

How to Conquer Simple Strong Website Analytics
/
Image shows the title of the article overlaid on an image a man examining graphs on tablet computer.
Ya'll... I went looking for an article on the basics of website analytics (a.k.a. "Google Analytics") and boy golly I could not find anything that was *actually* BASIC. Yes, it's complex. And it really doesn't need to be that big of a deal. Let's explore all the complexities of analytics and hone-in on something actionable.
Develop a Question
Data is meaningless without a purpose, so we're going to start with the purpose. Let's start with an ambiguous goal like: "know how my website is doing." With this goal and a glance at analytics, you'll become instantly overwhelmed. Because it's ALL THERE. Our computer overlords collect SO MUCH DATA. You can know ALL about the people who visit your website right down to the IP address. But overwhelm is not helpful, so we need to pick out just the bit of data that's most helpful.
Start thinking about what you want to know about your web visitors. Simple things would be questions like: "how many people visit the site?" or "where in the world are people accessing my site from?" To access more powerful information, consider questions about how people use the site. For example: "what pages do most people arrive on?" or "what type of device do people use to visit my site?" or "what search term did someone use that lead them to my site?" These types of questions inform you about what is working and allow you to maximize your efforts. Information that informs business decisions is where analytics shines brightest.

Image shows a graphic representation of which of my website pages people visited before joining my email newsletter.
Analytics has the capacity to track some very in-depth visitor behaviors. You can know answers to very granular questions such as: "Which pages did people view before submitting my contact form?" However, this necessitates setting up some more complicated systems in Google Analytics. It's important to weigh the cost-benefit of installing and troubleshooting the added code. I have done this for my business and it was not particularly fruitful. My web conversion rate is so low that this information isn't actually all that valuable. (But it does let me show off an image like this:)
In the nexus of easy-to-get and most-helpful are questions like: "What websites send traffic to my website?" "What google searches lead people to my website?" or "Which pages on my website are the most popular?" With this information, you can adjust promotion tactics or develop more popular content. Improving on what's already working will drive even more visitors. Jot down a question that you'd like to answer about your web traffic.
Answering Your Question

Image shows the same data for my website as reported by google analytics and squarespace analytics; the numbers are not the same, but they are trending in the same direction.
Before we dive into finding answers, I want to qualify some of what you'll see when looking at your analytics. Analytics numbers are inherently imprecise. This is because analytics systems try to clean the information they're working with. They filter out bots, ignore page refreshes, and avoid counting when you visit your own site. But this science is imperfect. Don't get stuck on the specific numbers; assume there's a margin of error. Instead, focus more on the trends over time. Trends are more likely to be accurate and point you in the direction of what's working and what's not.
Five Common Questions
It's impractical for me to psychically know how to answer your specific question. Here I'm going to dive into the answers to five sample questions. Hopefully, these will give you insight into how to answer your own question. I'm going to show examples from my Squarespace site. You'll find similar information on any analytics data provided on any website platform. If your platform doesn't have built-in analytics, Google Analytics is free and this article covers how to get it set up. Google Analytics is also designed around asking questions, so you can just type your question into the search bar and it’ll send you towards an answer!
How Many People?
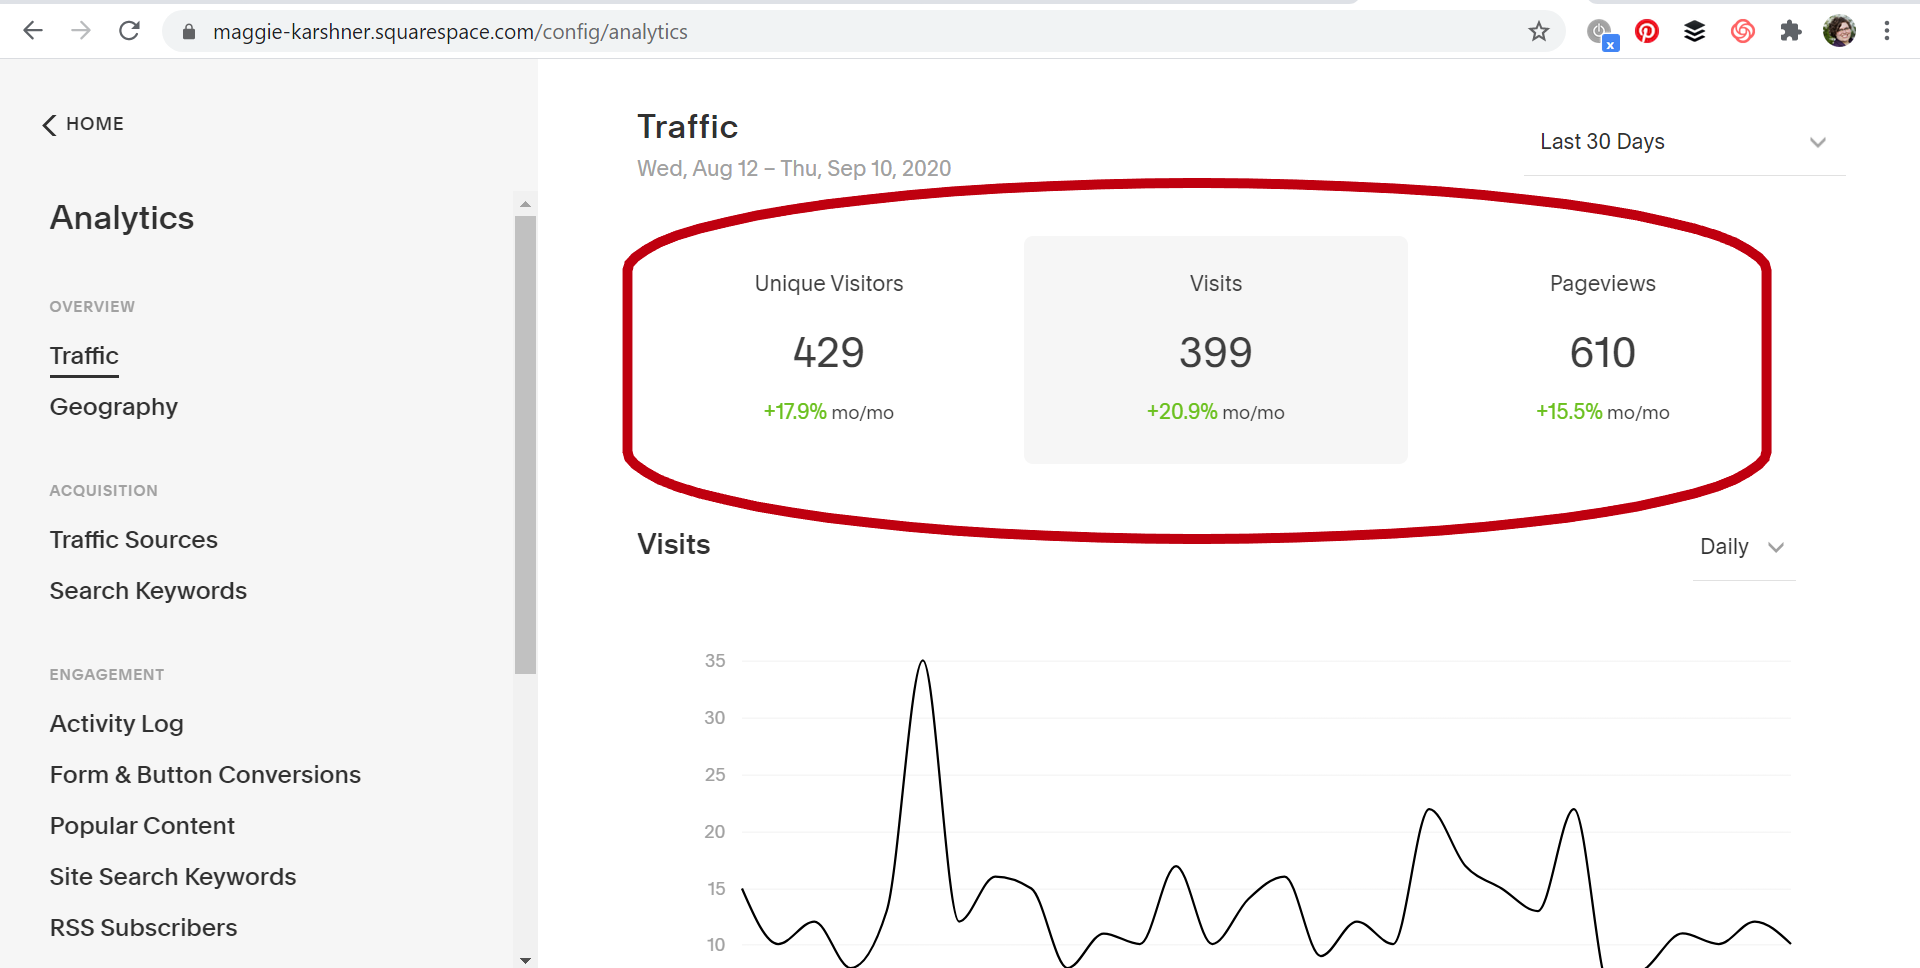
This image shows a screenshot of the “Traffic” area of Squarespace Analytics with the “Unique Visitors”, “Visits” and “Pageviews” data circled in red.
This is front and center on most analytics reports and divided out into two or three types. On Squarespace, they're named: Unique Visitors, Visits, and Pageviews. Let's say analytics watched as one person came to your site, viewed a bunch of pages. Then they left and came back again and viewed more. That would be one unique visitor, two visits, and many pageviews. Of course, you'll notice in the image, that I have more visits than visitors. Like I said before, the specific numbers are not as helpful as the trends. Squarespace indicates the trends as a percent in green under the total number.

This image shows a screenshot of the “Traffic” area of Squarespace Analytics with a graph of the “Visits.” I’ve highlighted with red arrows where you can change the time frame and granularity of data.
Trends are more informative over time, and you can adjust your time frame. Try changing to a long time frame (e.g. Year to Date or Last 30 Days) and a granular data unit (e.g. Daily instead of Monthly). Then examine the trend more than all the crazy jagged bits. In the attached image you'll see my trend is level except for whatever I did right in April!
Where do they come from?

This image shows a screenshot of the “Geography” area of Squarespace Analytics. The data shows that 63.9% of my visitors come from the United States. The United Kingdom and Canada each provide 6% of my website traffic, followed by India, Germany, Kenya, and Malaysia.
The geography of your visitors is another popular piece of data. Where your visitors come from will include some random countries. This is another example of imprecise data. Appreciate these random bots or people using VPNs for helping your website feel well-visited!
Most of your traffic will come from countries that speak languages on your website. You can drill down the granularity to specific states or metropolitan areas. Which ones are well represented? This likely won't be a surprise, but maybe you'll discover a fan club you didn't expect?! My site is popular in the state I live in, followed by the state I grew up in. This surprises no one.
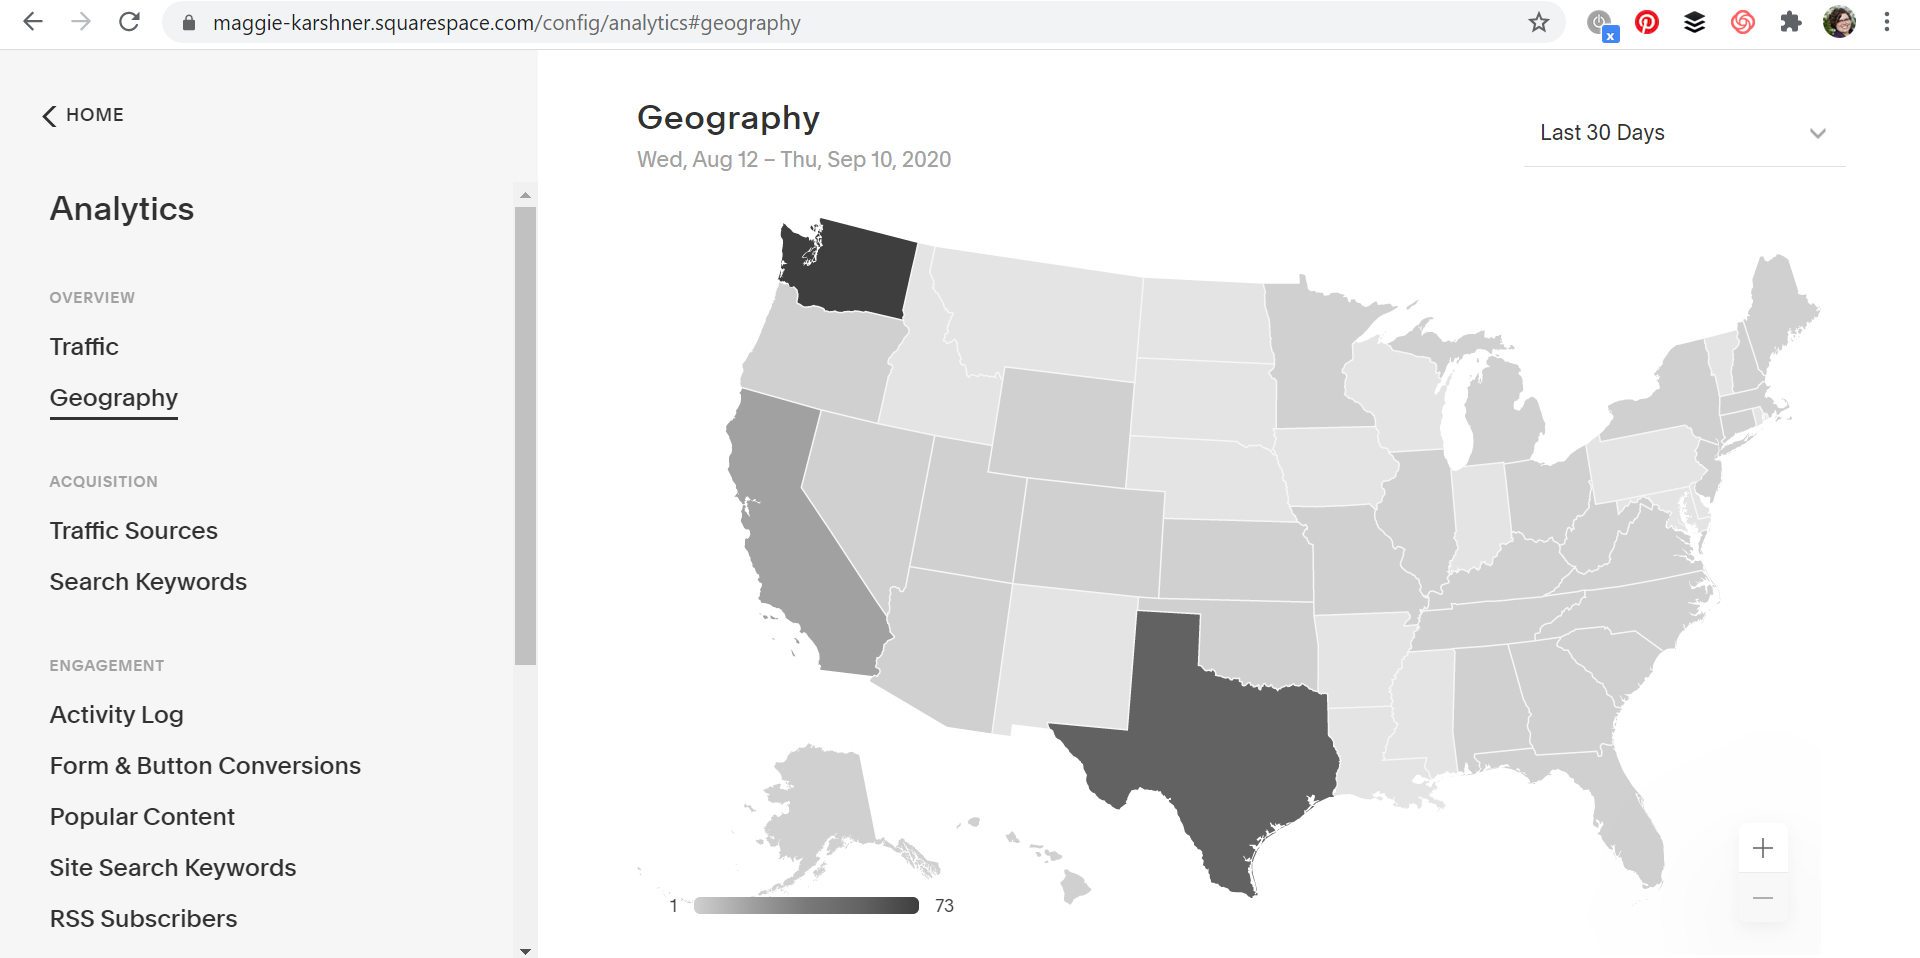
This image shows a screenshot of the map provided in the “Geography” area of Squarespace Analytics. The map shows the United States with the greatest density of visits coming from Washington state, followed by Texas.
What websites send traffic to my website?
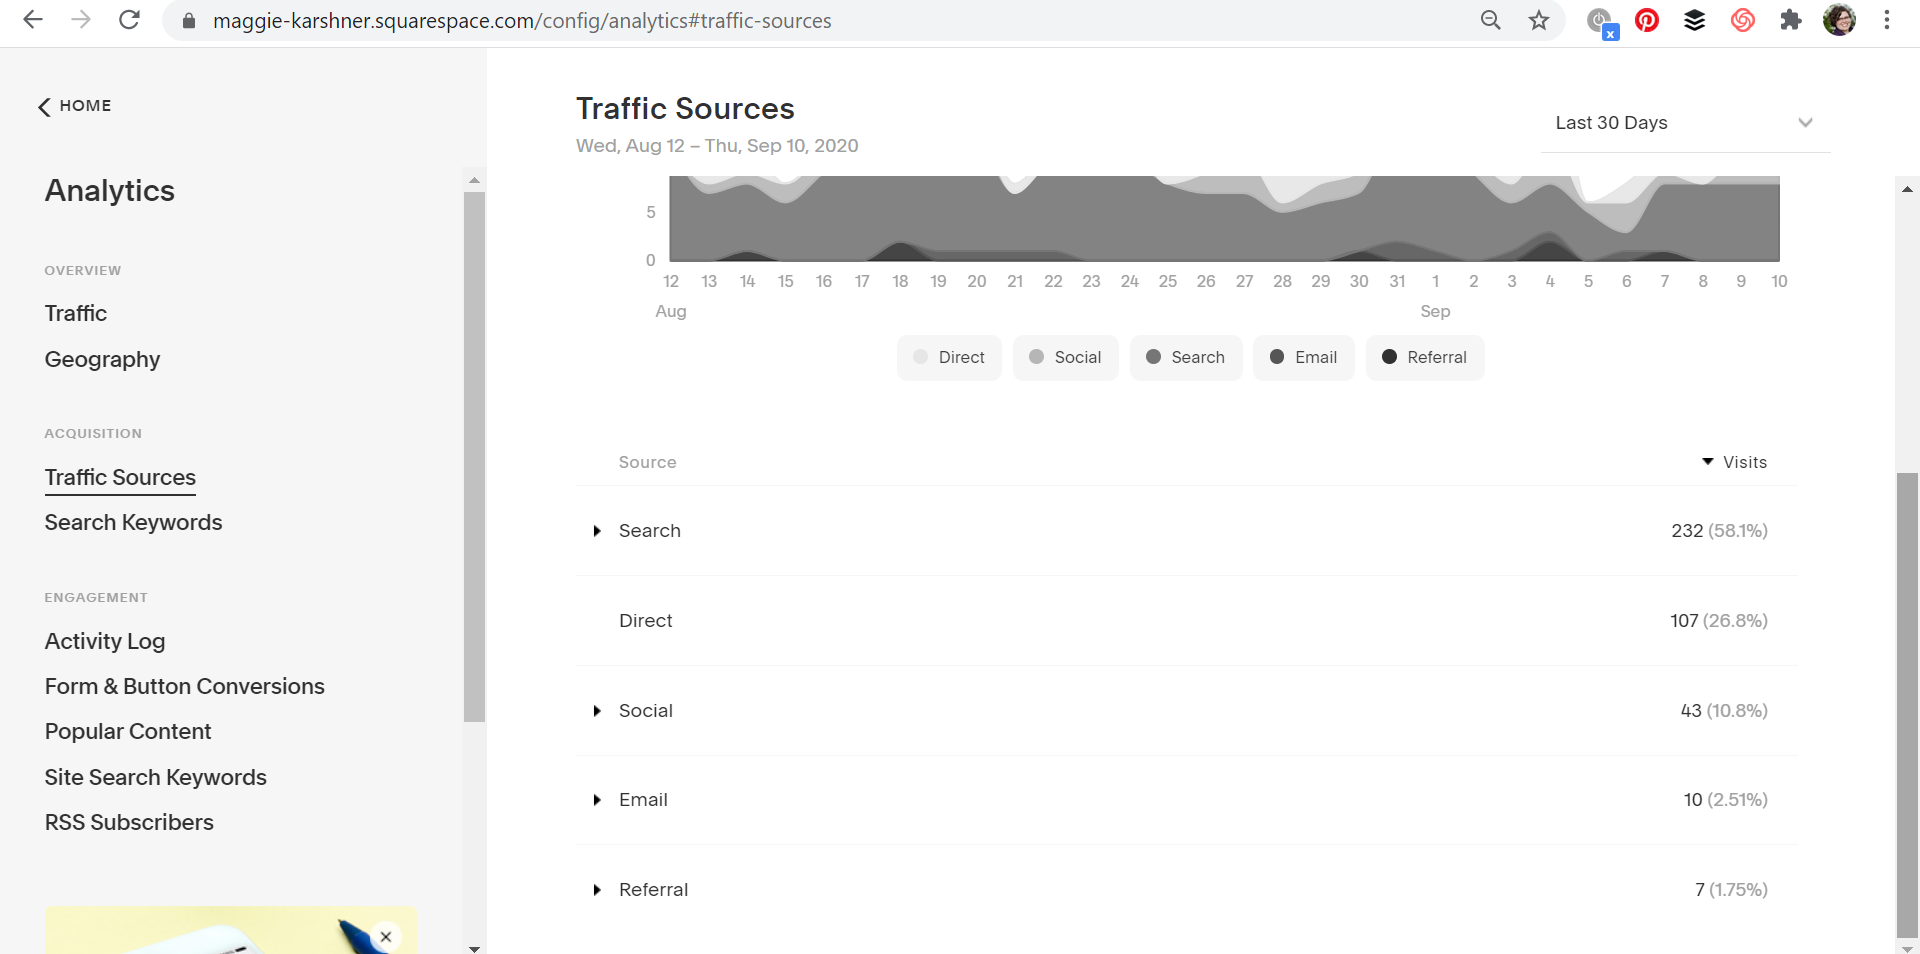
This image shows a screenshot of the “Traffic Sources” area of Squarespace Analytics. It shows that 58% of people arrive at my website from search results, 27% via “Direct”, 11% via Social, 3% via Email, and 2% via Referral.
Traffic sources help you understand what site people are on that leads them to your site. Most websites have most of their traffic fall in the "Direct" category. This is doubly true for young websites. The "Direct" category means they typed your URL directly into their browser and hit enter. I don't know anyone who actually does that, so I chalk this up to more of that imperfect data. Search, Social and Email are also popular categories. The Referral category will show you all the other websites that link to your site. This is usually where folks go "wait?! wtf are these websites?!" Let me sing my refrain again: the data is imperfect. Don't get caught up on that one visit from random-string-of-letters-dot-com. Instead, focus on what's working well and think about how you can monopolize on that.
What searches lead people to my website?

This image shows a screenshot of the “Search Keywords” area of Squarespace Analytics. It shows that I received 7 clicks to my yoga page from the keyword “yoga business coach;” 2 clicks to my home page from the keyword “business coach seattle” and 1 click each to my home page from the keywords “small business coach” and “business coach.”
Peak behind the google curtain and learn what people type in that leads them to your website. Check out the Search Keywords section for what phrases you're winning at. Each keyword ties to one page of your website, with "/" referring to the homepage. You can see in the image that my yoga page is winning at getting clicks when people search for "yoga business coach." My homepage is winning at the keywords: "business coach seattle," "small business coach," and "business coach." Because all these phrases match the content on the page, I know that my SEO is doing the right thing. If any of these phrases didn't seem relevant to the connected page, then I'd know it's time for an edit!
Which pages on my website/blog are the most popular?

This image shows a screenshot of the “Popular Content” area of Squarespace Analytics, displaying my top performing pages a described in the article.
When identifying your popular content, the internet treats web pages and blog pages as the same. If I was going to bet money, I'd bet your home page is going to be the most popular content on your website. In the attached image you can see my top-performing pages. These pages are, in order: my home page, a blog article, the main page for my blog, another blog article, the page people get when they join my email list, the page about my ongoing coaching services, and the page about coaching yoga businesses. What I can glean from this is that those two blog articles are doing something really right! This means I could try and write more content like that, or use similar SEO tactics.
Do Something With Your Question
Now that you've found an answer to your question, how does that change what you're working on in your business? The first time you look at your analytics might be too soon to find an answer. Instead, this first visit would produce a baseline that you can compare to later. When you return you can assess the success of your promotional efforts. Or this might have spurred a new idea for how to promote your business. It's helpful to check back in with data periodically. When do you plan to return and check in on your progress?
Website Analytics Worksheet
Want more help with organizing and tracking your analytic data? I developed a worksheet to keep your data orderly and consistent. Follow this link to learn more.